
Content
Variety trials
Local vegetable variety trial results help growers make decisions about which varieties to plant on their farms. However, there are vegetable growers in nearly every county of Nebraska and every corner of the world, and researchers can’t keep up with the demand for location-specific variety performance data for so many specialty crops. We know every farm is different, but we also know that climate and soil are major drivers of crop adaptation and performance around the world. With that in mind, we set out to aggregate and analyze all publicly available variety trial data (for three crops, to start). With this data, we developed the Vegetable Variety Navigator. The goal for this tool is to provide growers with information about variety yield and quality potential within and across specific locations. Using knowledge of your local climate and soil characteristics, you can use information from this tool to make predictions about how a specific variety might perform on your own farm.
This tool leverages data from nearly 300 variety trials of broccoli, cucumbers, and peppers across the world. We’ve analyzed these data to provide estimates of relative yield and quality potential for varieties included in at least three trials across distinct locations. Results of our analysis can be viewed through graphs or maps to explore geographic patterns in variety performance. Instructions for using the tool and important definitions are located below.
This is a decision support tool for growers with information about potential yield and quality of selected vegetable crops. Additional information about pest resistance, time to maturity, market classes, or availability of specific varieties can be obtained from your local extension office or seed distributor.
Learn more about interpreting results from this tool. Please contact Sam Wortman at swortman@unl.edu if you find any errors or have a suggestion on how to improve the tool.
Instructions
Graphs
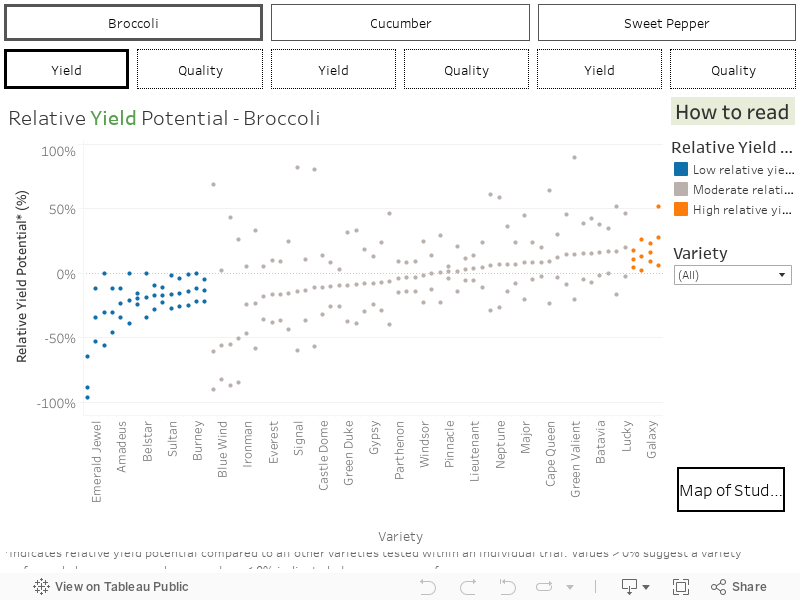
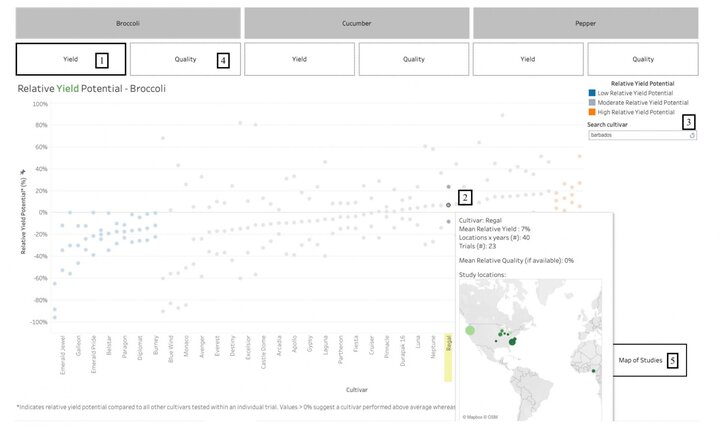
- To view yield data, click the “yield” button below your crop of interest.
- Hover over a single data point to view additional information.
- You may search for specific cultivars by typing the name into the “search cultivar” box located to the right of the graphs.
- To view quality data, click on the “quality” button below your crop of interest and repeat steps 2-3.
- To view the geographic distribution of the studies, click the “map of studies” button located in the lower right corner.
Maps
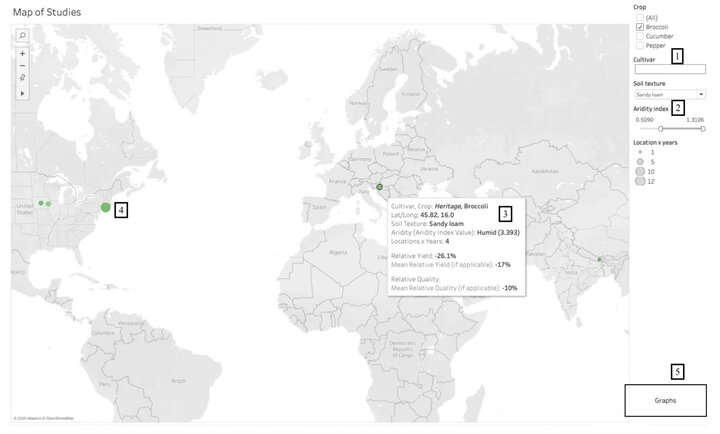
- Select a crop in the top right corner of the page.
- Search for a specific cultivar by typing the name into the “Cultivar” search box in the top right corner of the page.
- To narrow your results, you can apply search filters by soil texture or aridity index (a measure of climate). These filters are also located to the right of the map.
- Hover over a single data point to view information about yield and quality, and the characteristics of an individual study or location.
- The data points are color-coded such that the darker the green, the greater the mean relative yield value. The size of the data points corresponds to the number of years that contribute to the estimate of relative yield or quality at each location.
- To navigate back to the graphs, click the “graphs” button in the lower right corner.
Definitions
- Adaptability: how well a variety performs across different environments.
- A small difference between the upper and lower yield/quality potential indicates broad adaptability (less variation) of a variety across different environments.
- A large difference between the upper and lower yield/quality potential indicates narrow adaptability (more variation) of a variety across different environments.
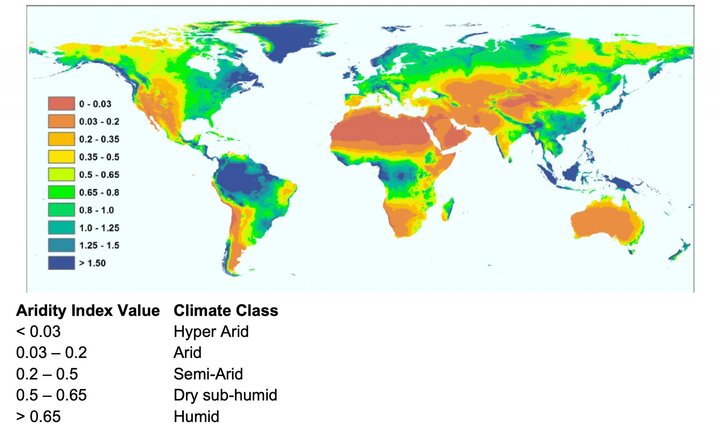
- Aridity index: a value that represents the ratio between precipitation and evapotranspiration. Index values >0.65 indicate a humid climate, whereas values <0.65 indicate a dry or arid climate. More information about the aridity index can be found below.
- Relative yield (or quality) (%): yield (or quality) potential of a variety in relation to the average yield of all other varieties in a particular study.
- Negative values indicate lower performance relative to other varieties from the same study.
- Positive values indicate higher performance relative to other varieties from the same study.
Interpreting Results
Example
Adaptability
Global Aridity Index
Aridity Index
Global aridity index values are expressed as a ratio of mean annual precipitation to mean annual evapotranspiration. In the map below, a higher aridity index value (green/blue colors) represents more humid conditions, and a low aridity index value (brown/yellow colors) represents more arid conditions.
Global Aridity Index
Global Aridity Index
In the video at left, Ali Loker provides an introduction to the aridity index.
Reference
Trabucco, Antonio; Zomer, Robert (2019): Global Aridity Index and Potential Evapotranspiration (ET0) Climate Database v2. figshare. Fileset. https://doi.org/10.6084/m9.figshare.7504448.v3
Acknowledgments and data submission
We would like to thank the growers and researchers involved in the below studies, all of which are included in this online tool. We are always looking for additional variety trial data to include in this tool. If you’d like more information about conducting your own on-farm trials, we recommend The Grower’s Guide to Conducting On-farm Variety Trials.